
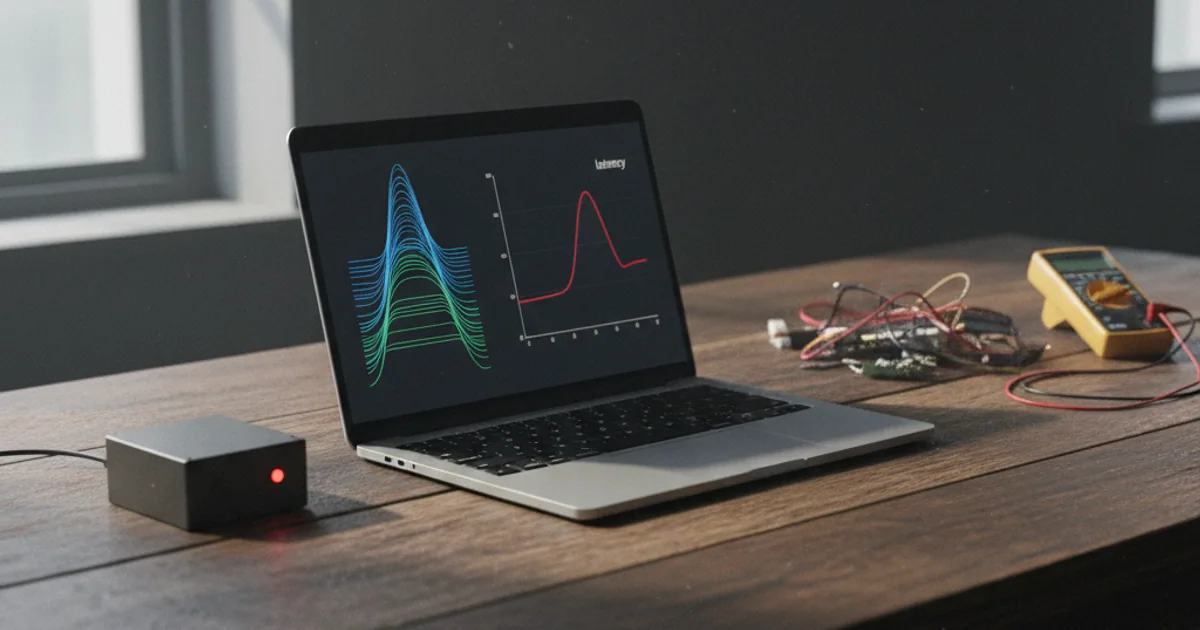
Evaluation tells you a change is good before you ship it. Monitoring tells you production disagrees. The two are different jobs, and skipping the second is how teams end up learning about a cost spike or a quality collapse from an angry user instead of a dashboard. Good monitoring watches a handful of signals continuously and pages a human when one of them moves in a way that matters.
The four signals that matter
Everything worth watching in an LLM app falls into four families.
Latency. Track p50 and p95, not the average, because LLM latency has a long tail that the average hides. Track it per step where you can, so you know whether a slow request was the model, the retrieval, or a tool. A p95 that creeps up is often the first sign of trouble.
Cost. Track tokens and dollars per request, plus a running daily total. Cost per request is the number that catches a prompt change that quietly tripled your context size. The daily total is the number that catches a runaway loop before finance does.
Reliability. Track error rate, timeout rate, and refusal rate as separate lines. A refusal is not an error to your infrastructure, but it is a failure to your user, so it earns its own line. A jump in refusals after a deploy usually means a prompt or safety change went further than intended.
Quality. Track an online quality signal on a sampled slice of traffic. This can be an LLM-as-judge score, a heuristic like "did the answer cite a retrieved document," or a thumbs-up rate from users. It will be noisier than your offline eval, but a sustained drop is real.
A minimal dashboard, then, is roughly:
| Panel | Metric | Why it earns a panel |
|---|---|---|
| Latency | p50, p95 per step | Catches the slow tail users feel |
| Cost | tokens and $ per request, daily total | Catches context bloat and runaway loops |
| Reliability | error, timeout, refusal rates | Separates infra failures from user-facing ones |
| Quality | online eval score on a sample | Catches regressions logs alone miss |
Alert on percentiles and rates, not averages
An alert on an average almost never fires when you need it to. Alert on p95 latency, on error and refusal rates, and on cost per request. And set the threshold from a baseline rather than a round number you liked. Run normally for a week, record what normal looks like, and alert on a margin above it:
alert: p95_latency > 1.5 * baseline_p95   for 10m
alert: refusal_rate > baseline + 5pp      for 10m
alert: cost_per_request > 2 * baseline     for 10m
A relative threshold fires when something changed. An absolute one either screams constantly or stays silent through a real incident.
Catching drift and regressions after a change
The single highest-value thing monitoring does is catch a regression right after you change a model or a prompt. Two habits make that reliable.
First, annotate the dashboard with every deploy. When a metric moves, the annotation tells you whether a change caused it or whether it drifted on its own. Correlating a spike to a deploy by memory is a waste of an afternoon.
Second, treat a model provider's silent update the same as your own deploy. Hosted models change under you without a version bump you control, so a quality line that drifts with no deploy annotation nearby is a signal to check whether the provider shipped something. When a metric crosses a threshold, open the offending traces from your tracing setup, read the actual prompts and responses, and the cause is usually obvious within a few examples. Monitoring points you at the request; the trace tells you why.

Comments 0
No comments yet. Be the first to share your thoughts.