
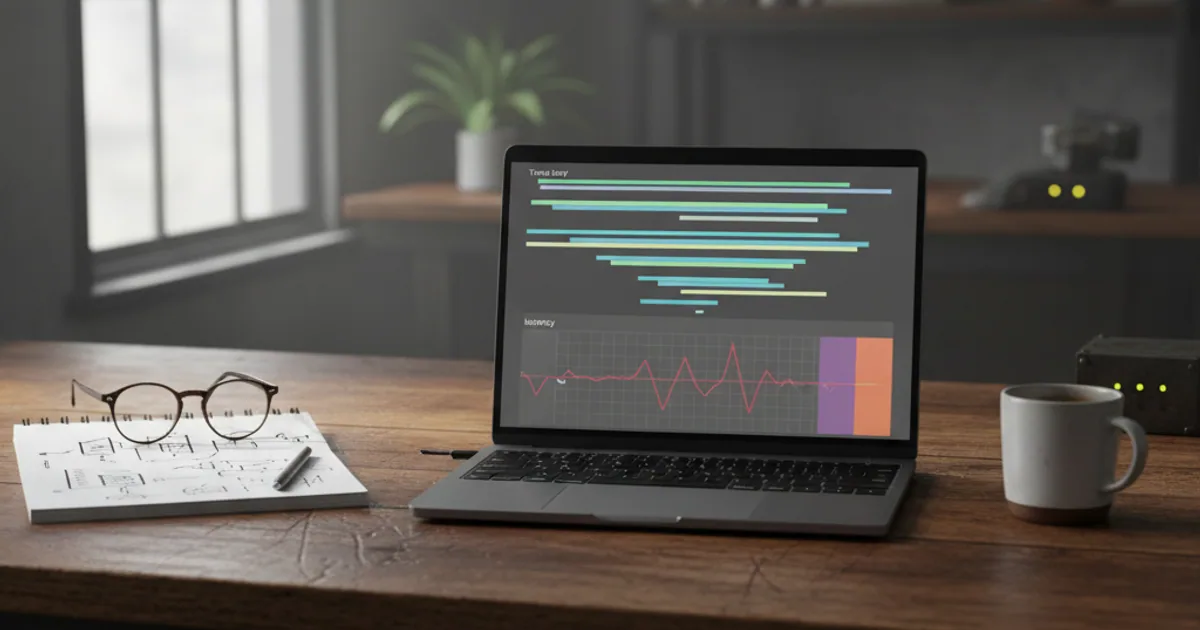
Ask "how long did that request take?" of a RAG app and the honest answer is "which part?" The retrieval, the re-ranking, the prompt assembly, the model call, the tool call, and the final formatting each took some time, and the one you care about is usually not the one you would have guessed. Tracing is what lets you answer the question properly. It records the whole request as a structured tree instead of a single stopwatch reading.
Spans, traces, and sessions
Three nested concepts do all the work.
- A span is one unit of work. One retrieval. One model call. One tool invocation. It has a name, a start time, a duration, and a bag of attributes.
- A trace is a tree of spans representing one full request. The root span is the whole request; child spans are the steps inside it.
- A session groups multiple traces from one logical conversation or user, so you can follow a multi-turn interaction across many requests.
You debug inside a trace. You spot patterns across sessions.
Tracing a RAG request end to end
Here is the shape of a RAG request as a span tree. Each indent is a child span:
trace: answer_user_question            (2.9s total)
  span: embed_query                    (40ms)
  span: vector_search                  (120ms)   -> 8 docs
  span: rerank                         (210ms)   -> top 3
  span: build_prompt                   (5ms)     -> 3,100 tokens
  span: llm_call                       (2.4s)    -> 480 output tokens, $0.011
  span: format_response                (12ms)
Read it top to bottom and the story is obvious: the model call dominates latency, retrieval was cheap, and the prompt was 3,100 tokens. If this request had returned a bad answer, you would open the vector_search span, read the eight documents it returned, and see immediately whether retrieval or the model was at fault. That is the whole point. The failure and its context stay attached.
An agent trace looks similar but with a loop: the model call produces a tool call, the tool span runs, its result feeds back into another model call, and so on until the agent stops. Tracing makes that loop legible instead of a wall of interleaved logs.
Why the single API call is not the unit
The tempting shortcut is to log only the final model call, since that is where the answer comes from. It fails in practice because most bad answers are not the model's fault. Retrieval returned irrelevant documents. A tool timed out and got silently retried. The prompt was built from a truncated context. None of that is visible in the model call alone. The trace is the unit because the request is the unit.
Standards and tools
Two things worth knowing.
OpenTelemetry is the vendor-neutral tracing standard, and it now defines GenAI semantic conventions that standardize attribute names like the model, token counts, and tool-call details. Instrumenting with these conventions means your traces are portable and your dashboards do not break when you switch backends.
Purpose-built LLM tracing tools exist as a category, and Langfuse and LangSmith are two examples of it, not endorsements. They add LLM-aware features on top of raw tracing: prompt playback, token and cost roll-ups, and eval-score attachment. Some accept OpenTelemetry data directly. The right pick depends on whether you value the open standard, the managed convenience, or both. Whichever you choose, the discipline is the same: trace the request, not the call.

Comments 0
No comments yet. Be the first to share your thoughts.